
How Extreme Was Recent Large Growth Outperformance?
Investors concerned about US small value stocks’ recent relative returns should be aware of how extreme large growth’s outperformance has been.


US small value stocks underperformed large growth stocks by about 4.5% per year over the past five years. Some investors have asked what went wrong with small value to garner such underperformance. Looking at returns over this period compared to the long term, we see the story is more about what went anomalously right for large growth.
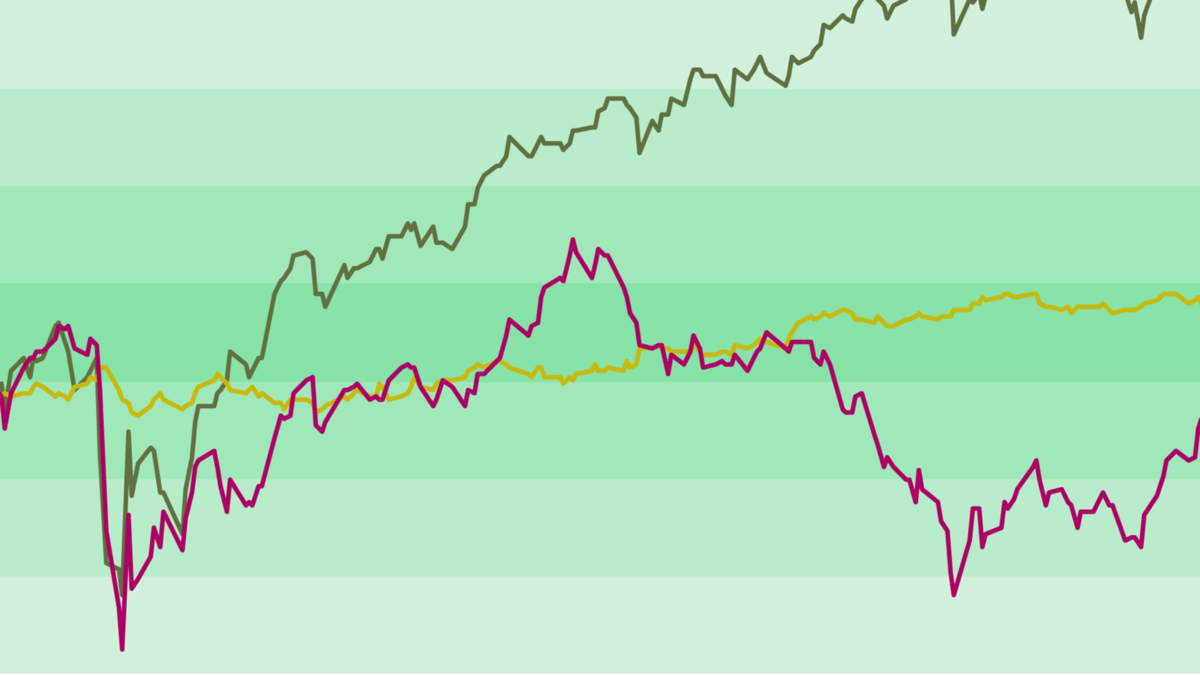
Small value’s five-year number was squarely in the middle of its historical range of outcomes for rolling five-year returns, which span from –1.1% at the 10th percentile to 28.8% at the 90th percentile. Small growth and large value were both similarly far from their extremes over the past five years. Large growth, on the other hand, bumped up against its 90th percentile outcome of 19.6%.
It’s not clear that recent performance for value versus growth is helpful in predicting the future. A historically good run for growth doesn’t imply these stocks will come back to earth. But investors concerned about small value’s recent relative returns should be aware of which asset class outkicked its coverage over this stretch, while still enjoying the boost in return it provided to the overall market.
Exhibit 1
5-Year Rolling Returns
July 1926–November 2024

This article originally appeared in Above the Fray, a weekly newsletter for Dimensional clients. It was not created, written, or produced by TwoTen Planning.
Index descriptions
Results shown during periods prior to each index’s index inception date do not represent actual returns of the respective index. Other periods selected may have different results, including losses. Backtested index performance is hypothetical and is provided for informational purposes only to indicate historical performance had the index been calculated over the relevant time periods. Backtested performance results assume the reinvestment of dividends and capital gains. Profitability is measured as operating income before depreciation and amortization minus interest expense scaled by book. Eugene Fama and Ken French are members of the Board of Directors of the general partner of, and provide consulting services to, Dimensional Fund Advisors LP.
Fama/French US Small Growth Research Index: Provided by Fama/French from CRSP securities data. Includes the higher 30% in price-to-book of NYSE securities (plus NYSE Amex equivalents since July 1962 and Nasdaq equivalents since 1973) that have smaller market capitalization than the median NYSE company.
Fama/French US Small Value Research Index: Provided by Fama/French from CRSP securities data. Includes the lower 30% in price-to-book of NYSE securities (plus NYSE Amex equivalents since July 1962 and Nasdaq equivalents since 1973) that have smaller market capitalization than the median NYSE company.
Fama/French US Large Growth Research Index: Provided by Fama/French from CRSP securities data. Includes the higher 30% in price-to-book of NYSE securities (plus NYSE Amex equivalents since July 1962 and Nasdaq equivalents since 1973) that have larger market capitalization than the median NYSE company.
Fama/French US Large Value Research Index: Provided by Fama/French from CRSP securities data. Includes the lower 30% in price-to-book of NYSE securities (plus NYSE Amex equivalents since July 1962 and Nasdaq equivalents since 1973) that have larger market capitalization than the median NYSE company.
Source: Ken French website.
Disclosures
The information in this material is intended for the recipient’s background information and use only. It is provided in good faith and without any warranty or representation as to accuracy or completeness. Information and opinions presented in this material have been obtained or derived from sources believed by Dimensional to be reliable, and Dimensional has reasonable grounds to believe that all factual information herein is true as at the date of this material. It does not constitute investment advice, a recommendation, or an offer of any services or products for sale and is not intended to provide a sufficient basis on which to make an investment decision. Before acting on any information in this document, you should consider whether it is appropriate for your particular circumstances and, if appropriate, seek professional advice. It is the responsibility of any persons wishing to make a purchase to inform themselves of and observe all applicable laws and regulations. Unauthorized reproduction or transmission of this material is strictly prohibited. Dimensional accepts no responsibility for loss arising from the use of the information contained herein.
This material is not directed at any person in any jurisdiction where the availability of this material is prohibited or would subject Dimensional or its products or services to any registration, licensing, or other such legal requirements within the jurisdiction.
“Dimensional” refers to the Dimensional separate but affiliated entities generally, rather than to one particular entity. These entities are Dimensional Fund Advisors LP, Dimensional Fund Advisors Ltd., Dimensional Ireland Limited, DFA Australia Limited, Dimensional Fund Advisors Canada ULC, Dimensional Fund Advisors Pte. Ltd., Dimensional Japan Ltd., and Dimensional Hong Kong Limited. Dimensional Hong Kong Limited is licensed by the Securities and Futures Commission to conduct Type 1 (dealing in securities) regulated activities only and does not provide asset management services.
RISKS
Investments involve risks. The investment return and principal value of an investment may fluctuate so that an investor’s shares, when redeemed, may be worth more or less than their original value. Past performance is not a guarantee of future results. There is no guarantee strategies will be successful.
UNITED STATES
Dimensional Fund Advisors LP is an investment advisor registered with the Securities and Exchange Commission.
Investment products: • Not FDIC Insured • Not Bank Guaranteed • May Lose Value
Dimensional Fund Advisors does not have any bank affiliates.
The foregoing content reflects the opinions of TwoTen Planning and is subject to change at any time without notice. Content provided herein is for informational purposes only and should not be used or construed as financial, legal, tax, or investment advice or a recommendation regarding the purchase or sale of any security. There is no guarantee that the statements, opinions or forecasts provided herein will prove to be correct. Past performance may not be indicative of future results. All investing involves risk, including the potential for loss of principal. There is no guarantee or assurance that diversification, strategies based on Nobel prize-winning research, or any investment plan or strategy will be successful.
More Free Resources?
Sign up and receive our complimentary guide plus FREE regular updates!
Our Most Recent Blogs
Check out our most recent blogs where we share insightful articles, trends, and news from a Christ-centred perspective in the financial industry.


“For we are His workmanship, created in Christ Jesus for good works, which God prepared beforehand that we should walk in them.”
